Practical guide
Water Report OEL vs LRAA: Why the Same Results Can Trigger Different Checks
Calculate the current-quarter-weighted OEL, compare it with a four-quarter LRAA, and locate the utility’s evaluation record.
OEL and LRAA answer different system questions
An operational evaluation level (OEL) and a locational running annual average (LRAA) can differ even when they use results from the same monitoring location. The illustrated four-quarter LRAA averages four quarterly values. The OEL uses the two previous quarters plus twice the current quarter, divided by four.
The distinction matters when reading a utility’s operational evaluation or annual narrative. A recent rise has more influence on the OEL. An OEL exceedance triggers an evaluation process for the water system; it is not a different name for the four-quarter MCL calculation.[1][2]
This guide explains the specified quarterly arithmetic and report-reading route. It supplies no household treatment design, personal exposure estimate or clearance for an active advisory. A real utility and its responsible authority determine applicable monitoring and required actions.
Keep the three quarter values in chronological order
Call the two previous quarterly values P2 and P1, and the current value C. The OEL formula is (P2 + P1 + 2 × C) ÷ 4. The current value contributes half the calculated value, and each preceding value contributes one quarter. The oldest value in a four-quarter window is not used in this OEL formula.
Use the same analyte, location and units throughout. The reproduced 40 CFR 141.626(a) text specifies a TTHM OEL exceedance when the calculated value is greater than 0.080 mg/L and an HAA5 exceedance when it is greater than 0.060 mg/L. Those are 80 and 60 µg/L after unit conversion.[1]
Do not substitute the latest individual sample for a required quarterly value without knowing the monitoring method, combine results from several locations, swap TTHM and HAA5, or replace missing results with zero. The formula needs the stated inputs. A report displaying rounded values may not provide enough precision for an exact boundary judgment.
One rising series demonstrates an OEL above a lower LRAA
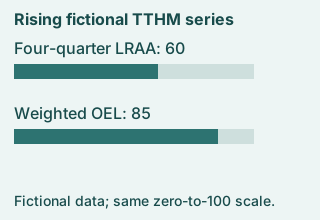
All results in this example are invented, exact TTHM quarterly values for one fictional location. The complete four-quarter sequence is 20, 40, 60, 120 µg/L, ordered from oldest to current. Its four-quarter mean is (20 + 40 + 60 + 120) ÷ 4 = 60 µg/L.
Its OEL is (40 + 60 + 2 × 120) ÷ 4 = 85 µg/L. The current 120 receives twice the weight of either prior quarter. Thus the illustrated OEL is above 80 while the illustrated four-quarter LRAA is 60. This explains how the two calculations can point to different checks; it does not assert that any real system has these results.
EPA’s historical comprehensive guide labels the OEL procedure as an operational evaluation intended to address peaks. Its Table 5 gives this same weighting structure. The guide’s August 2010 date is preserved; the arithmetic is also checked against the reproduced section 141.626 text.[3]
A falling series and an equality check prevent two shortcuts
The next table includes every quarterly value for three invented TTHM series. Each uses the same units and exact inputs. A different trend changes the relationship between the two statistics; there is no universal rule that an OEL is always higher.
For the Falling series, the four-quarter mean is 80, while the OEL is 55. The oldest 120 still contributes to the four-quarter mean but not to the three-quarter OEL. For the Boundary series, the OEL is exactly 80, so it is not greater than 80 under the specified exceedance test. This says nothing about additional monitoring rules or the precision of a real rounded report.
On a narrow screen, scroll inside the table to read the final column. Keyboard users can focus it and press the right-arrow key.
| Series | Oldest | Previous 2 | Previous 1 | Current | Four-quarter LRAA | OEL |
|---|---|---|---|---|---|---|
| Rising | 20 | 40 | 60 | 120 | 60 | 85 |
| Falling | 120 | 100 | 80 | 20 | 80 | 55 |
| Boundary | 20 | 40 | 40 | 120 | 55 | 80 |
An operational evaluation is a utility process with a readable record
Section 141.626(b) requires a system that exceeds an OEL to conduct an operational evaluation and submit a written report to the State no later than 90 days after notification of the analytical result causing the exceedance. It says the written report must be available to the public upon request.[1]
The listed evaluation concerns system treatment and distribution practices, including storage, flushing, source changes and treatment changes that may contribute to TTHM or HAA5 formation. These are utility operational questions. The article is not a set of instructions for altering a home’s disinfectant or plumbing.
If a utility narrative mentions an OEL, a useful next question is: “Which analyte, monitoring location and quarter caused the calculation? What does the operational evaluation report say, and what current public instructions apply?” Read the response and any notice on their own terms.
Do not relabel an OEL exceedance as a proven MCL violation without the applicable MCL calculation. Also do not treat a lower LRAA as permission to disregard an OEL action or a current advisory. The LRAA guide explains location, quarterly grouping and less-frequent monitoring exceptions.
Three checks before quoting an OEL
Case 1
For 20, 40, 60, 120 µg/L, is the OEL the plain three-value mean of 40, 60, 120?
Show answer and explanation for case 1
No. The specified OEL is 85 µg/L.
Use (40 + 60 + 2 × 120) ÷ 4 = 340 ÷ 4 = 85. The current quarter is doubled; dividing 220 by 3 would apply another formula.
Case 2
For 120, 100, 80, 20 µg/L, must the OEL exceed the four-quarter LRAA?
Show answer and explanation for case 2
No. The OEL is 55 and the four-quarter LRAA is 80 µg/L.
The OEL uses 100, 80 and twice 20; the oldest 120 is absent from its numerator. An OEL is not necessarily the larger statistic.
Case 3
With exact inputs 20, 40, 40, 120 µg/L, does an OEL of 80 exceed 80?
Show answer and explanation for case 3
No. Equality does not satisfy the specified greater-than test.
(40 + 40 + 240) ÷ 4 = 80. A real rounded display may conceal the original precision, so request the issuer’s calculation rather than assuming these exact premises.
Sources and further reading
- Cornell LII — 40 CFR 141.626, Operational evaluation levelsComplete section checked 8 November 2026: exact weighted formula, strict exceedance, utility evaluation and public report upon request. Cornell LII reproduces the federal regulation; apply the responsible authority’s current requirements to an actual system.
- Cornell LII — 40 CFR 141.620, General requirementsComplete section text checked 8 November 2026. Paragraph (d) distinguishes quarterly monitoring, within-quarter averaging, available-data calculations and less-frequent monitoring. Cornell reproduces the CFR; this is not a site-issued compliance ruling.
- EPA — Comprehensive Stage 1 and Stage 2 DBPR Quick Reference GuideEPA 816-F-10-080, August 2010. All four rendered pages read, including tables 3–5 and footnotes. Used for the explained statistics; historical deadlines are not presented as new obligations.